The question of performance is always topical. Over our 15 years of experience in designing and building digital solutions, we’ve noticed that the conversation about performance indicators is always relevant and that it deserves to be thoroughly examined.
Indeed, without relying on indicators, how do we know if the solution is successful? And how do we continuously improve it so that it remains sustainable and meets long-term objectives?
However, it’s sometimes possible to know the importance of key performance indicators without mobilizing them on a daily basis.
In this article, find out how to select these indicators – then, how to use them on a daily basis.
Summary
1. Selecting relevant key performance indicators
2. Understanding the different types of indicators
3. Interpreting the key performance indicators
4. Reacting to unsatisfactory results
5. The best time to define the key performance indicators
6. How often to analyze the key performance indicators
1. Selecting relevant success indicators
Selecting the key performance indicators is obviously a crucial step. To do it properly, it’s important to remember the following elements:
A. Translate your business objectives into success indicators
Real-time access to hundreds of pieces of data represents a real opportunity to measure your performance in a broader way. It is therefore appropriate to base your business objectives on tangible and reliable indicators, thereby transforming your internal processes to base them on data analysis. The business objectives are the solution’s reason for being—that is, the impact that it will have on our operations or our business. Then, it’s a matter of finding the specific indicators that will show if we’re successful or not.
For example, we want to deploy a customer portal to encourage digital self-service for certain transactions. The expected result is a reduction in the volume of transactions carried out through the other channels (customer service over the phone, in store, via chat, etc.).
The main success indicator in this case is the volume of transactions completed in each service channel. We can compare them from one month to the next to track the progress. If the digital transformation is properly executed, in a dashboard, we will see a gradual increase in volume on the digital solution and a decrease in volume from the traditional points of service. Another indicator would be a percentage increase in transaction volume across all contact points, reflecting the growth of the business.

B. Don’t have too many
One of the main reasons that prevent us from using key performance indicators to their full potential is the overabundance of them. Buried in a pile of information, the person or people in charge of analyzing it face a paradox of choice that prevents them from advancing properly. You could use the OKR method to select the specific indicators to measure (objectives, key activities, results).
It is therefore a matter of having the right level of information, organized by category. It’s also possible to divide it by department, since a digital solution often meets the needs of several teams at once. You could aim for a maximum number of three dashboards per person, for example.
C. Have multiple levels of analysis
The purpose of the dashboards is to provide a high-level overview of the data. These dashboards must therefore be easy to understand. However, they must be supplemented with tools that allow for a more in-depth analysis when necessary. For example, this is the correlation that exists between Looker Studio and Google Analytics.
D. Proactive indicators
Finally, the key performance indicators selected in the first and fifth years will be drastically different, which is normal. As with the evolution of a digital solution, you have to be proactive, always improve the relevance of these indicators, and question them many times so that they continue to resonate with your objectives.
2. Understanding the different types of indicators
Before selecting them, it’s important to identify and understand the objectives associated with the different types of key performance indicators.
- Qualitative indicators: Heat map showing the clicks on a screen or scroll depth, screen recordings, user feedback, or customer satisfaction rate. These indicators are used to test, explain, and support hypotheses formulated based on quantitative indicators.
- Quantitative indicators: total number of active users, number of conversions, application downloads, uninstallations, application rating, campaign conversion. These indicators are valuable for having a complete view and making the data speak holistically, since they are intrinsically linked.
- User indicators: results of user and usability tests, NPS (Net Promoter Score), retention rate, percentage of users who have taken specific actions, unsubscribe rate, success rate of a task. These indicators let you understand the needs of each type of user and therefore continuously improve their experience.
- Technological performance indicators: crashes, loading time, errors, etc. This data is important for identifying the points of friction related to the technology so that they can be resolved.

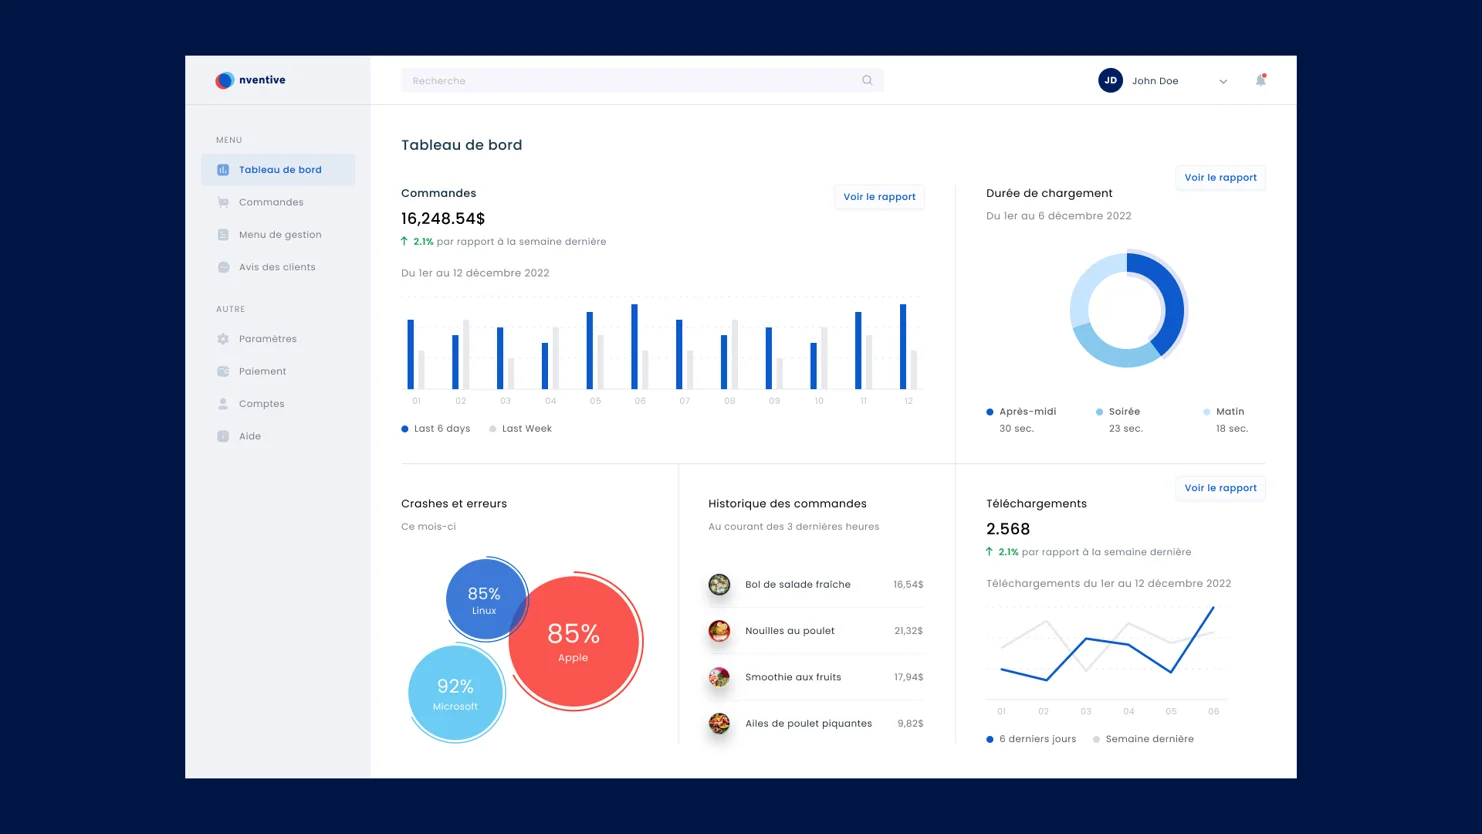
The main success indicators can be compiled in a dashboard that is easy to access and share with the various stakeholders. The incoming data can come from different systems (CRM, analytics, surveys, etc.), which broadly makes it possible to see the health of the product at a glance and react quickly if necessary.
If we return to our example of the self-serve platform, a simple dashboard would include:
- Transaction volumes by channel (CRM);
- A specific section on digital performance with quantitative indicators such as engagement rate, average time spent, and traffic origin (analytics);
- Performance-related data such as slowdowns, errors, and crashes (monitoring);
- A section on customer feedback with satisfaction indicators.
3. Best practices for interpreting the key performance indicators
In the end, the success of a digital solution allows us to determine whether our investment is profitable. Throughout the lifespan and evolution of the solution, the indicators provide a health checkup on several levels and offer targeted courses of action to improve performance.
To effectively interpret the key performance indicators, it’s important to remember the following elements:
- The selected time period plays a key role in the analysis of the data. Of course, it’s crucial to compare periods with each other and to choose the most relevant duration(s): day, week, month, or even quarter… it all depends on your business objectives.
- The number of users considerably affects the relevance of the results. It is therefore necessary to wait a few weeks before obtaining results that can be interpreted objectively.
- Analyzing trends over time can provide valuable insights into the performance of your business. By monitoring certain key indicators over time, you can identify trends that will help you make more informed decisions.
4. Reacting to unsatisfactory results
The key performance indicators are sometimes lower than the expected results. It’s best to recognize the situation to be able to act effectively.
Performance shortfalls may be the result of decisions made to circumvent project constraints, mitigate another risk, or depend on the information and assumptions that we had at the time of development.
This is the advantage of iterative digital development: it is continually possible to optimize, test, and improve.
When the expected result is not achieved, an investigation should be conducted to analyze more specific indicators, which are most of the time integrated into the product, presented above.
Depending on the results of these underlying indicators, which will usually have been established at the start or during the project, it will be possible to initiate the necessary improvements to bring about a recovery.
5. When to define the key performance indicators
As explained, it would be ideal to define these indicators as soon as the product vision is defined, since they must meet the business objectives. However, if the appropriate measurement tools were not implemented in the solution at the time of its design, they can easily be added, and this can be done iteratively.
6. How often to analyze the success indicators
The health checkup of the digital product should be performed regularly. That way, you can react quickly with improvements to the content and design experience or apply technical fixes. This also lets you monitor the impact of the changes on the dashboard.
A good practice to implement is to hold at least one specific monthly meeting to note and discuss the key performance indicators as a group. In particular, this will allow you to disseminate knowledge, identify action points, and plan additional analyses to be conducted.
In the context of agile development, allocating a certain percentage of the workbook to optimizations, evolutions, and bug fixes helps reduce its accumulation of technological debt over the lifespan of the solution. The risk of ending up with an outdated solution in need of major repairs just before being replaced is reduced!


