Would you drive a car without a dashboard, without any indication of its condition or if the engine check light was on? Obviously, you would assess how it performs before hitting the road. The same logic applies to your digital experience: to gauge its success with your users, data analysis offers a comprehensive view of its state, ensuring you make decisions consistent with your business objectives.
More Than Just After-Sales Service
Data analysis is often offered as a complementary service to follow and measure the performance of a digital product once it hits the market. According to our strategists, it would be a missed opportunity to plan the product development phase and the selection of its features without foreseeing tangible data from the start that will measure its success with your users. These considerations fuel your thinking and will have a significant impact on future results.
That’s why at nventive, we recently refocused our product development methodology by reaffirming the importance of addressing analytics and performance monitoring from the early stages of a new project’s design. The goal is to quickly focus the development of the experience on performance, conversion, behavior measurement, and eventually product optimization. This is how we ensure the longevity of your product even before it becomes an application in the hands of your users.
How it Integrates in the Lifecycle of Our Projects
To ensure we have a solution tailored to your needs, it’s crucial that we understand your priorities from the pre-sale stage. By sharing your existing dashboards with our experts, we can align our proposal with your business objectives and quickly identify opportunities to boost the performance of the new project.
At the planning stage, we assess the scope of the work. If your project spans different platforms, we can gather information in a single dashboard to obtain demographic and behavioral data linked to your key performance indicators (KPIs). These should be directly linked to the main features of your solution (transactions, newsletter sign-up, form downloads, etc.) to make it easier to target interventions as needed.
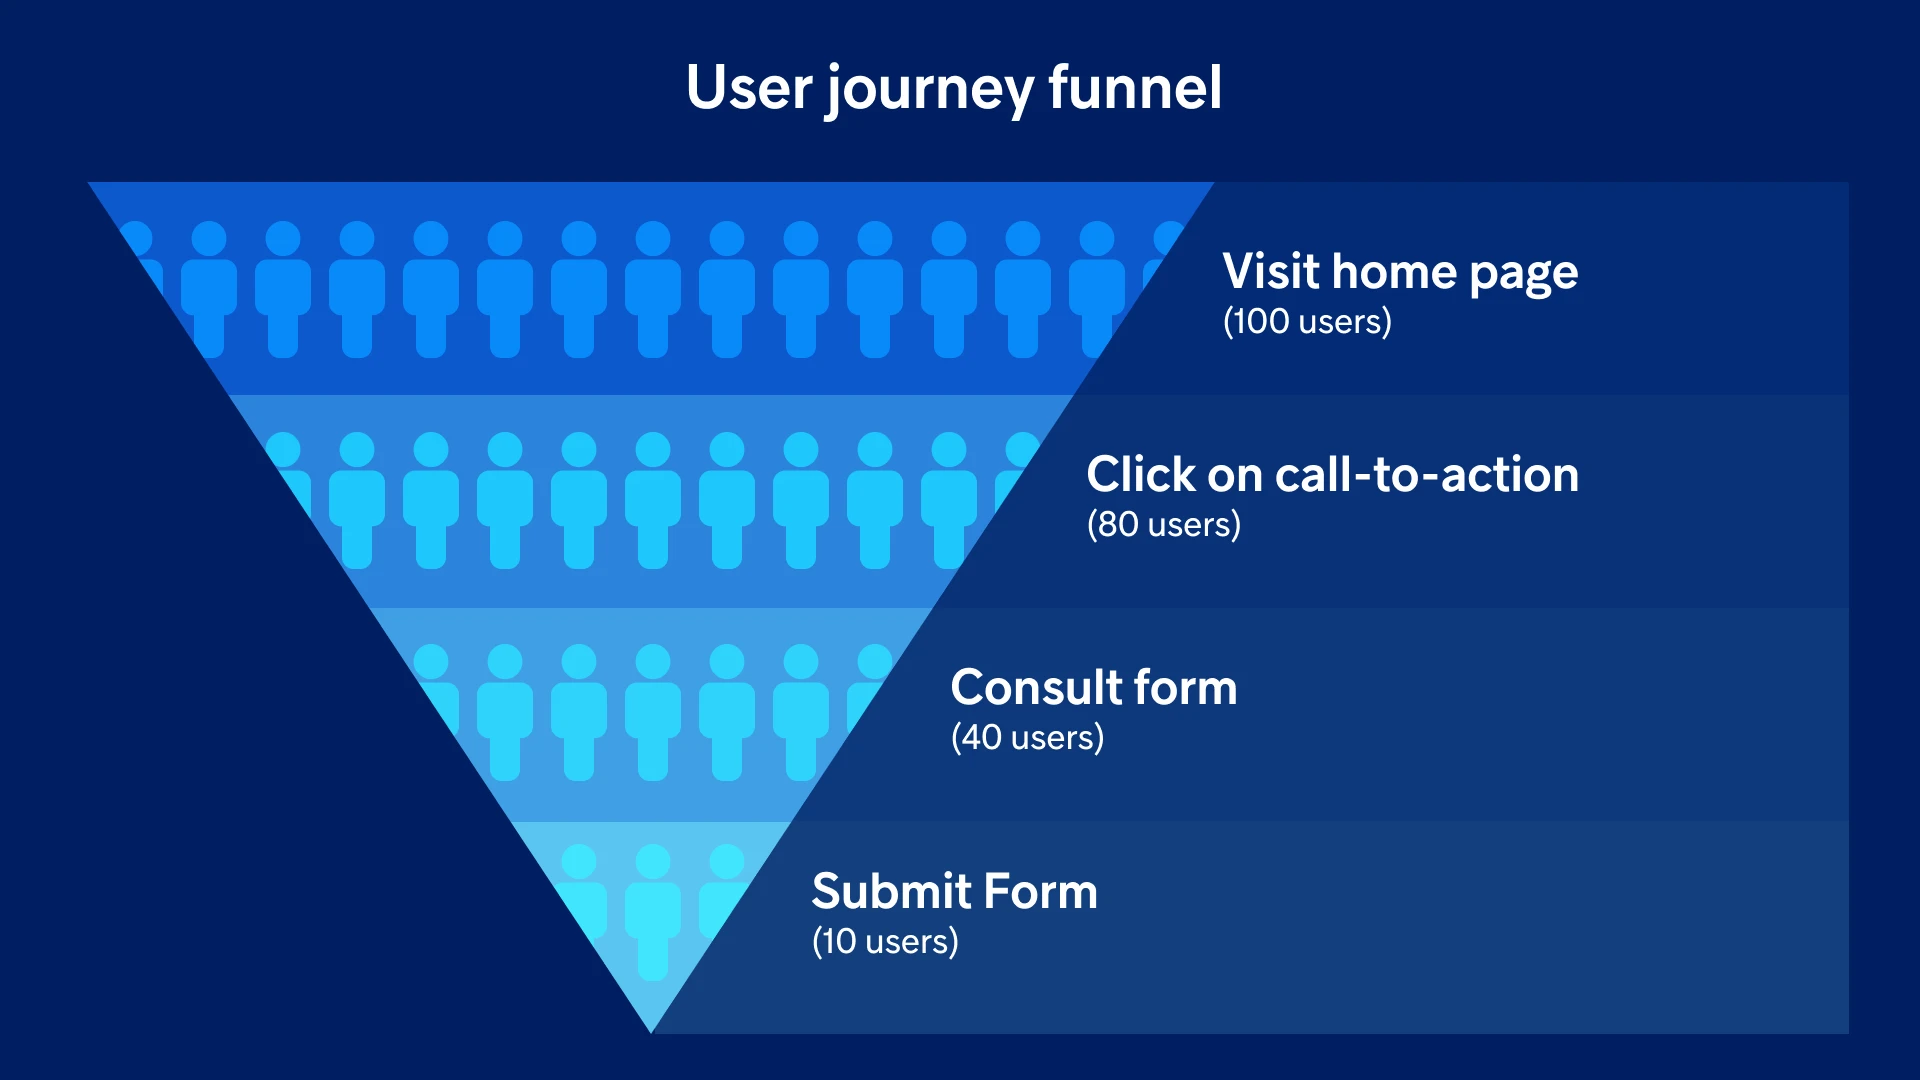
During the early design stages, you should define one or more conversion funnels. Associating measurement points with key actions related to the goals allows us to optimize the product’s performance early in the process.
“By understanding user behavior on your application, it’s possible to evolve the product and adjust the steps of the journey and clarify it so that users can complete their task to the end,” explains Stéphanie Mercier, digital strategist at nventive.

Finally, implementation and quality assurance are done during development to ensure everything is functional from the solution’s launch.
What We Keep an Eye On
In data analysis, what we concretely measure are events, items that reflect actual behaviors on the application. To track these events, a well-known platform is obviously Google Analytics, but others are regularly used like Amplitude, Smartlook, Hotjar, or Microsoft Clarity, for example.
Google Analytics offers a vast repertoire of specific events collected automatically, without configuration or deep implementation. These include the number of visits, acquisition of new users, engagement duration, device model used, or even if the latest update has been installed. The automatically collected metrics vary slightly between mobile and web applications.
If you wanted to explore further, it’s possible to enrich the analysis by activating enhanced measurements. These automate the tracking of more actions like video playback or entries in a search field and include additional data streams to Google Analytics, from your mobile apps and websites. The platform also uses the concept of event parameters that can be configured to enrich subsequent data analyses.

Most apps and websites are designed to help users accomplish specific actions (complete a transaction, sign up for a newsletter, etc.). To track the success of these actions, it’s beneficial to measure the completion rate at each step – commonly called a “funnel.” These are generally specific user-triggered actions that we want to measure, such as clicks on calls to action, downloads, form submissions, or adding items to a cart, for example. These metrics are parameters defined in Google Analytics and are typically set up during funnel configuration.
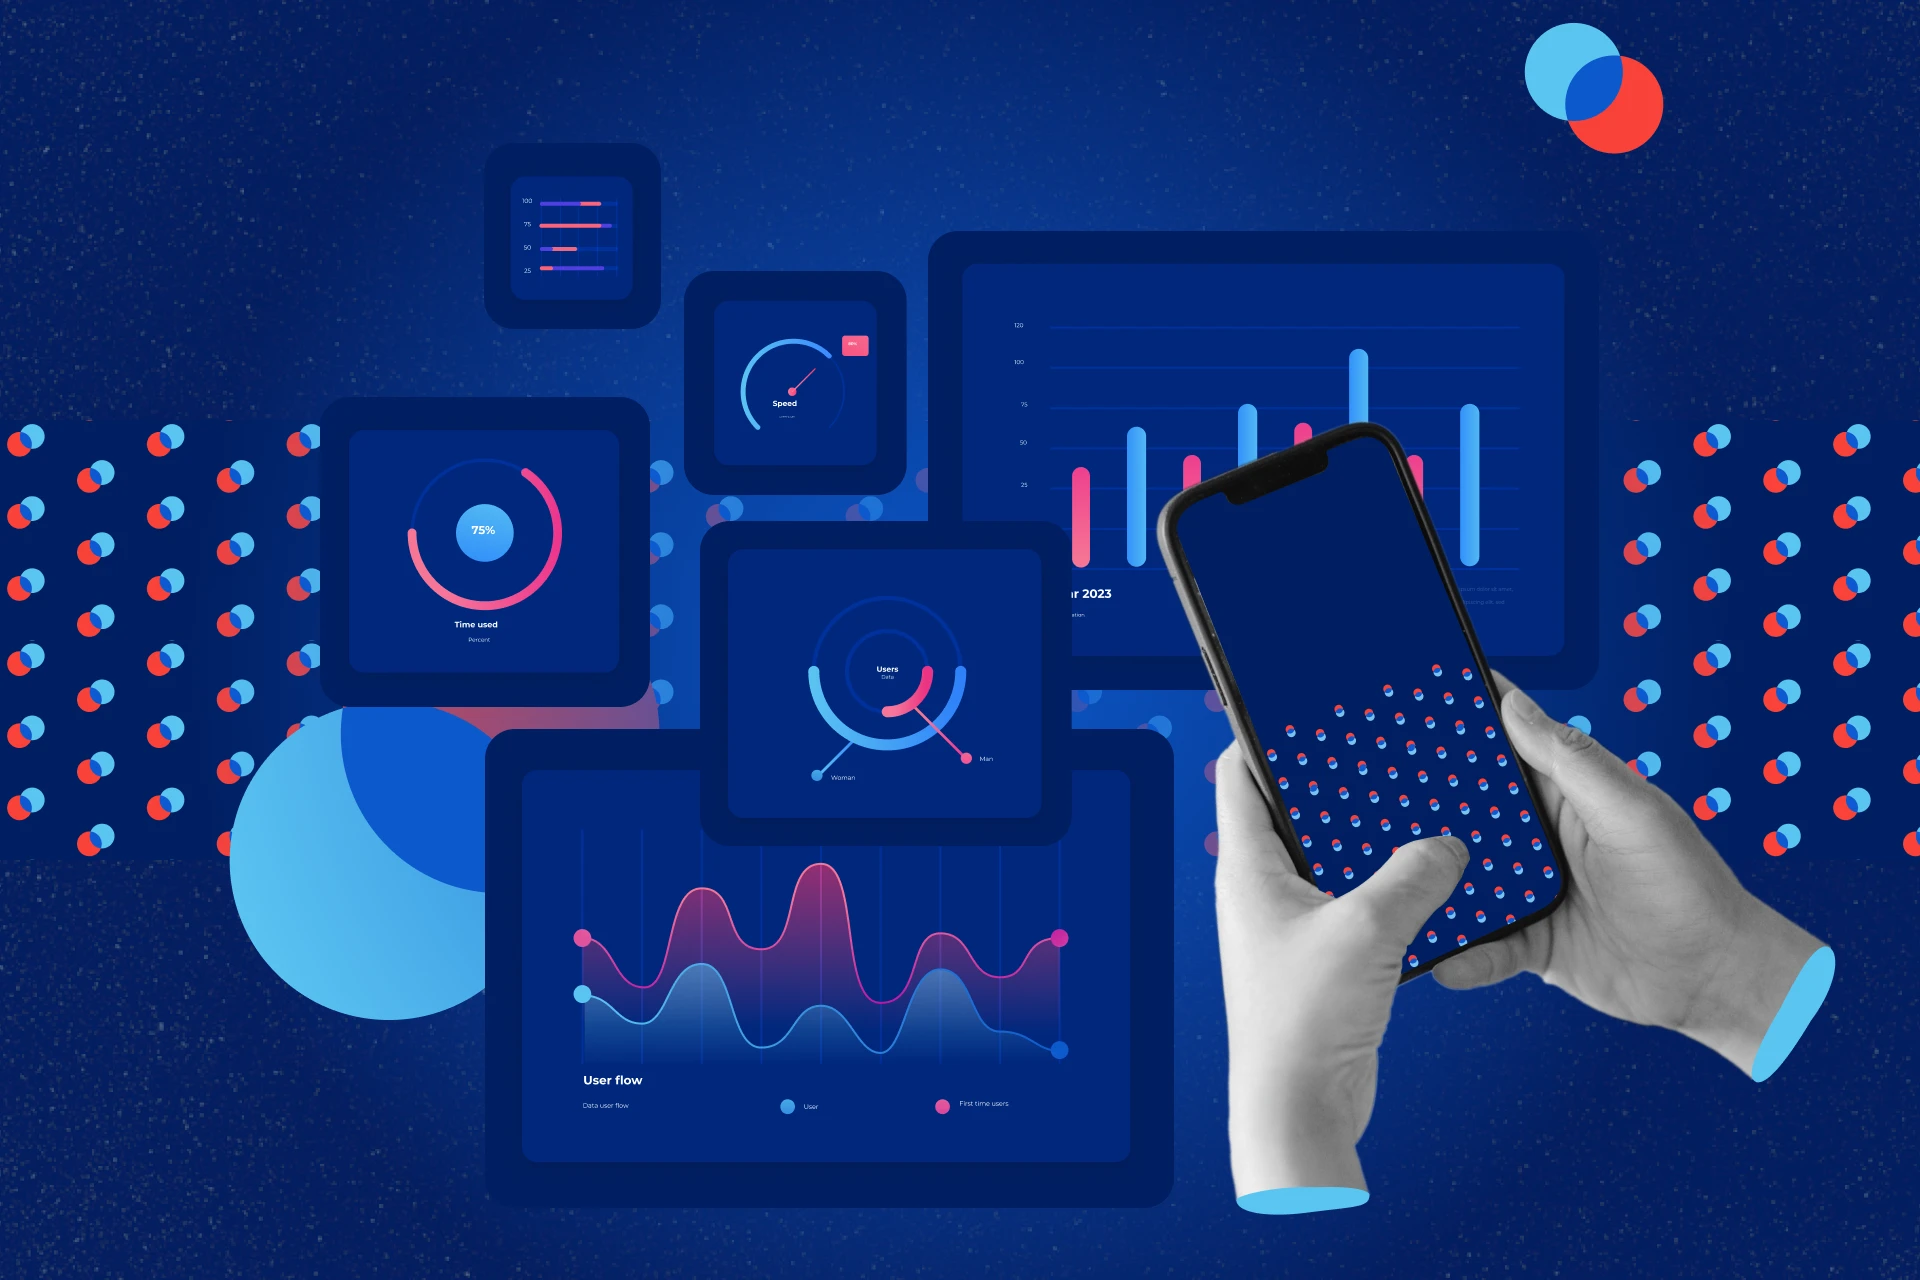
For tracking and consultation, the data can be manipulated, and a multitude of reports can be generated directly in the Google Analytics platform. For executive or operational teams with more limited consultation needs, the ideal solution is a more streamlined dashboard configuration made in a platform like Looker (formerly Data Studio) to quickly visualize and grasp project performance. These allow for a glance at the main indicators.
Depending on the scope of your analytical needs, we can guide you in selecting metrics to analyze to obtain the most comprehensive tracking of your product’s success. We will take into account the limitations of automatic events and evaluate whether it would be better to develop enhanced measurement to obtain more in-depth information. The idea is to get the most comprehensive overview to enable us to respond to performance variations and optimize accordingly.
Throughout our business relationship, with relevant data points in hand, our experts will be in a better position to apply the results of data analysis, notably by implementing powerful features and effective user journeys that amplify observed performances. They will thus be better able to support you during the product launch as they will already know its full optimization potential. All you need to do is keep an eye on your dashboard to make the right moves, build your marketing campaigns in light of the results—and entrust the ongoing maintenance of the product to our dedicated team!


